

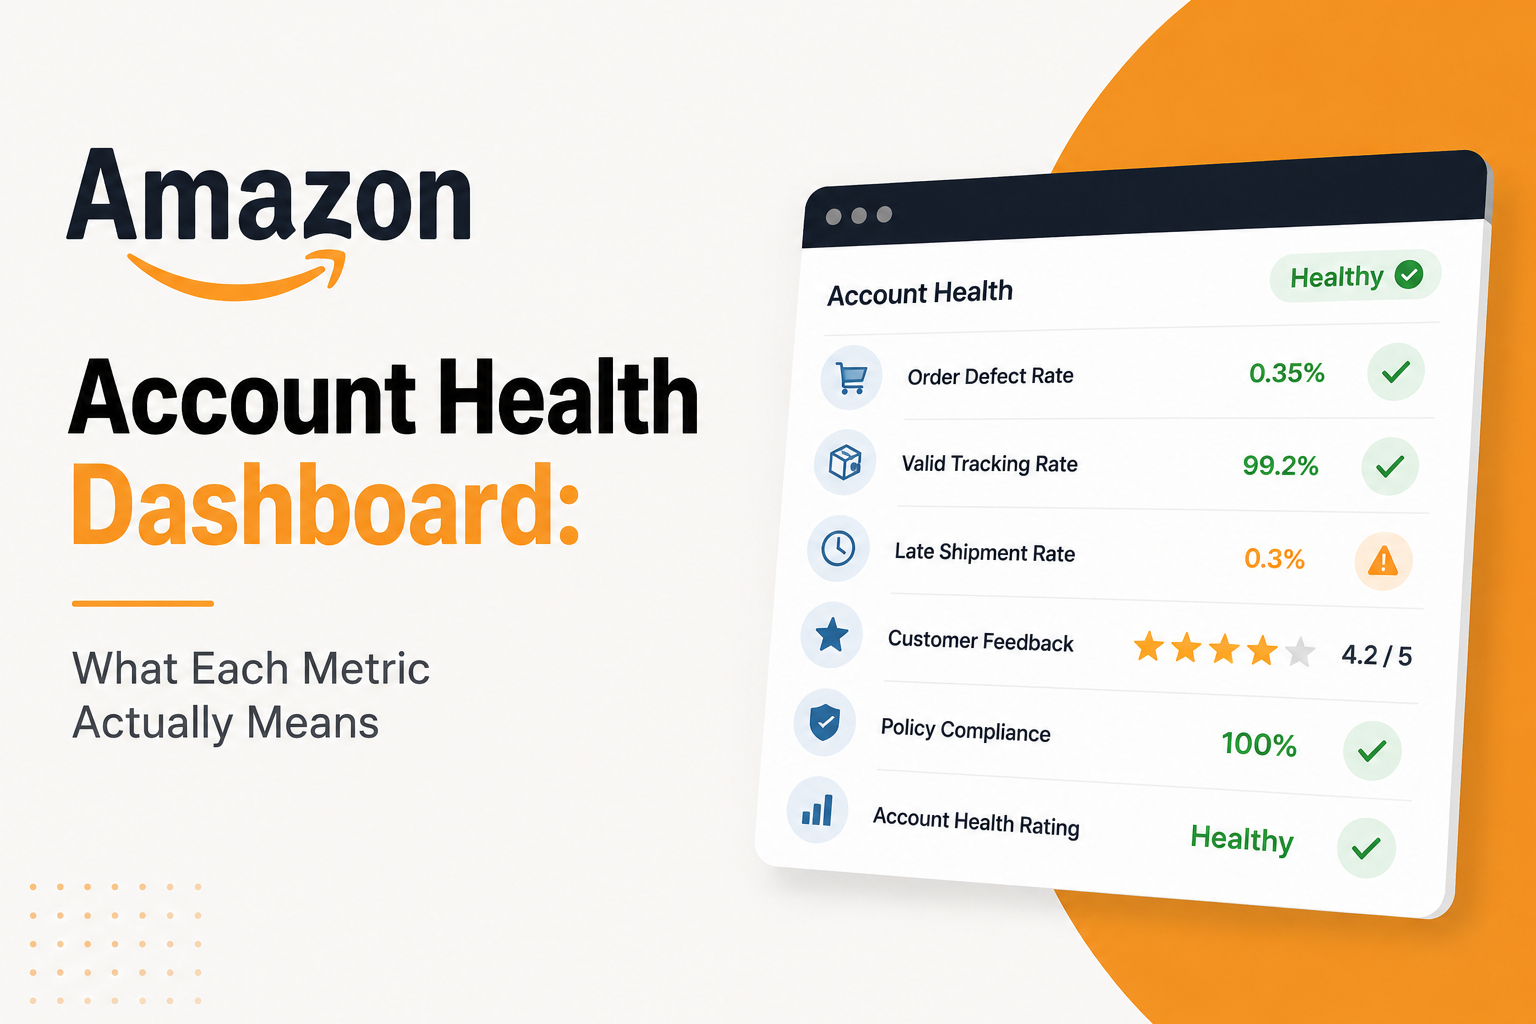
The Account Health Dashboard is Amazon’s report card for your account. Most sellers only look at it after a warning hits their inbox, which means they’re reacting instead of preventing. Here’s what each metric measures, what target to hit, and what actually moves the number, so you can read your own dashboard at a glance instead of guessing.
Quick Reference: Every Metric and Its Target
| Metric | Target | Applies To |
| Account Health Rating (AHR) | 200+ | All sellers |
| Order Defect Rate (ODR) | Under 1% | All sellers |
| Late Shipment Rate (LSR) | Under 4% | Seller-fulfilled (FBM) |
| Valid Tracking Rate (VTR) | Near 100% | Seller-fulfilled (FBM) |
| On-Time Delivery Rate (OTDR) | 90% minimum, 95%+ recommended | Seller-fulfilled (FBM) |
| Pre-Fulfillment Cancel Rate | Under 2.5% | Seller-fulfilled (FBM) |
| Policy Compliance | Zero active violations | All sellers |
Skim the table, then jump to whichever metric is actually giving you trouble.
Account Health Rating (AHR): Your Overall Score
What it is: A single composite score summarizing your entire account. It pulls in policy compliance, ODR, and shipping performance into one number.
Target: New sellers start at 200. Stay at or above 200 to be considered healthy.
What moves it: The score drops when Amazon detects a violation and recovers as issues resolve (most stop counting against you after 180 days). A minor slip, one late shipment, costs a few points. A serious violation, like a product authenticity complaint, can cost dozens of points in a single hit. Amazon doesn’t publish the exact deduction formula, so treat AHR as a trend to watch, not a number to optimize precisely. If it’s drifting down over a few weeks, one of the metrics below is the cause.
Order Defect Rate (ODR): The One That Triggers Suspensions
What it is: The percentage of your orders with a defect, combining negative feedback (1-2 stars), A-to-z Guarantee claims, and credit card chargebacks. Multiple defects on one order still count as a single defect.
Target: Under 1%, measured on a rolling 60-day window.
What moves it: A handful of bad orders in a slow month can push a low-volume seller over 1% fast. Category matters too: apparel sellers dealing with 20-30% return rates carry far more ODR pressure than a home goods seller at 5-10%. This is the metric most tied to a full account suspension when it’s left unmanaged.
How to fix it: Respond to negative feedback and buyer messages fast, and proactively refund or replace when something’s clearly gone wrong on your end, before it turns into a claim or chargeback.
Late Shipment Rate (LSR): An Operations Metric
What it is: The percentage of seller-fulfilled orders confirmed as shipped after the promised ship date.
Target: Under 4%, tracked over both a 10-day and 30-day window. Doesn’t apply to FBA, since Amazon owns that timeline.
What moves it: Handling times set tighter than your actual fulfillment capacity, or inventory gaps that delay order confirmation.
How to fix it: Match your handling time settings to reality rather than the fastest number that looks good, and build in buffer for weekends and holidays.
Valid Tracking Rate (VTR): The Easy One to Miss
What it is: The percentage of shipments with a valid, carrier-confirmed tracking number. Amazon uses this to verify delivery actually happened.
Target: Close to 100%. This now covers all carriers, not just Amazon-integrated ones.
What moves it: Tracking invalid numbers, never scanned, or uploaded through a non-integrated carrier without confirmation syncing back to Amazon.
How to fix it: Confirm your shipping software is pushing valid tracking data back to Seller Central consistently, especially if you use regional or freight carriers.
On-Time Delivery Rate (OTDR): The Metric Amazon’s Been Tightening
What it is: The percentage of seller-fulfilled units delivered to the customer by the promised delivery date, calculated without counting Amazon’s own weather or carrier-related promise extensions. This makes it stricter than the delivery date customers actually see.
Target: 90% is the hard minimum before enforcement kicks in; Amazon recommends staying at 95% or higher for safe standing.
What moves it: Slow handling times, inconsistent carrier performance, and products that just don’t ship fast enough for the delivery promise Amazon is showing. As of a February 2026 policy update, falling below 90% no longer deactivates your entire seller-fulfilled catalog; Amazon now targets only the specific listings dragging the rate down, though sustained poor performance can still escalate further.
How to fix it: Turn on Shipping Settings. Automation and automated handling time so Amazon adjusts your promises to match real performance. For products that consistently run late, moving them to FBA removes them from OTDR risk entirely.
Pre-Fulfillment Cancel Rate: An Inventory Signal
What it is: The percentage of seller-fulfilled orders you cancel before shipping.
Target: Under 2.5%, measured over a 7-day window.
What moves it: Selling inventory you don’t actually have, almost always caused by a mismatch between what Seller Central shows and what’s actually on the shelf.
How to fix it: Tighten inventory sync, especially if you’re also selling on Walmart or your own site, since stock can drift out of alignment across channels fast.
Policy Compliance: The One That Blindsides Sellers
What it is: Tracks intellectual property complaints, product authenticity claims, restricted product violations, and other policy flags that don’t fit into a clean percentage.
Target: Zero active, unresolved violations.
What moves it: A single complaint, a listing change that crossed a category-specific rule, or a batch of counterfeit claims can hit without warning. This is the category behind many of the mistakes in our breakdown of common Seller Central mistakes, like outdated verification documents or ignored policy update notices.
How to fix it: Submit a Plan of Action as soon as a violation appears. Unlike performance metrics, these need manual review to clear, so they sit unresolved longer the more you delay.
Frequently Asked Questions
How often should I check the Account Health Dashboard?
Weekly. Every metric here is a trailing average, so by the time it crosses a threshold, the orders causing it already happened days or weeks ago. Weekly checks give you enough runway to fix a drifting number before it becomes a violation.
Which metric matters most?
Order defect rate carries the most weight for suspension risk since it reflects buyer experience directly. On-Time Delivery Rate is the one to watch most closely if you’re seller-fulfilled, since Amazon’s enforcement on it has gotten stricter recently.
Does switching to FBA fix most of these?
It removes the late shipment rate, valid tracking rate, on-time delivery rate, and pre-fulfillment cancel rate from your risk entirely, since Amazon owns fulfillment. It doesn’t touch ODR or policy compliance, so it lowers risk without eliminating it.
Can a single violation tank my score?
Yes, if it’s serious. A minor issue costs a handful of points. A major one, like an authenticity complaint, can cost dozens in one hit.
Do old violations stay against me forever?
No. Most resolved violations stop affecting your score within 180 days, which is why addressing them quickly matters more than waiting them out.
Don’t Wait for a Warning Email
If you’re only checking your dashboard after Amazon flags something, you’re already behind. AMZOS runs a free Amazon account audit covering every metric here, plus inventory, PPC, and listings, so you catch drifting numbers before they turn into a suspension.